Mean and Standard Deviation
Find the mean and standard deviation of 2, 4, 4, 4, 5, 5, 7, 9 step by step: mean 5, population SD 2, sample SD √(32/7) ≈ 2.14.
Narrated by a synthetic voice (Piper TTS, en_US-ljspeech-high voice (LJ Speech dataset, public domain)). Download MP4 (0.6 MB) · Captions (WebVTT)
On-screen maths
Every board from the lesson, so you can read it at your own pace or copy it into your notes.
- 1. The data0:00
values
- 2. Mean0:11
- 3. Squared deviations0:19
- 4. Standard deviation0:31
- population
- sample
- 5. Recap0:46
- Mean: add, then divide by .
- Square the deviations, add them up.
- Divide by (population) or (sample), then take the square root.
About descriptive statistics
Mean, median, mode, variance and standard deviation.
Practise what you just watched
Three measures of center for one small data set.
A data set whose mean is 5 and whose variance comes out to a perfect square.
- Mean Median Mode Calculator: try the same kind of problem with your own numbers.
- Standard Deviation Calculator: try the same kind of problem with your own numbers.
- More statistics practice problems
- Descriptive Statistics Study Guide (study guide)
- AP Statistics Unit 1: Exploring One-Variable Data: the AP unit this lesson supports.
- Statistics calculators and topics
- Step-by-step solver: check your own answer with hints.
Unofficial study material. This site is an independent educational resource and is not affiliated with or endorsed by the College Board. AP® is a trademark registered by the College Board, which is not involved in producing this content.
More video lessons
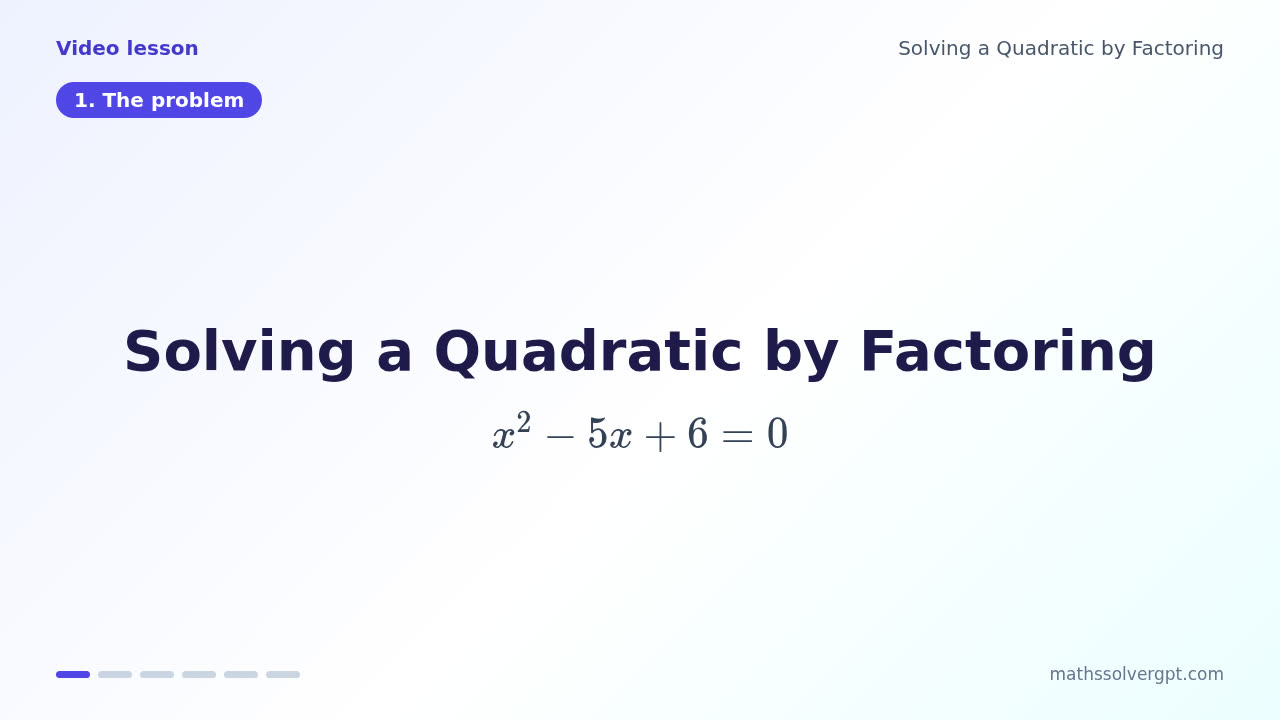 1:17
Solve x² − 5x + 6 = 0 by finding two numbers with the right product and sum, then check the roots on the graph and by substitution.
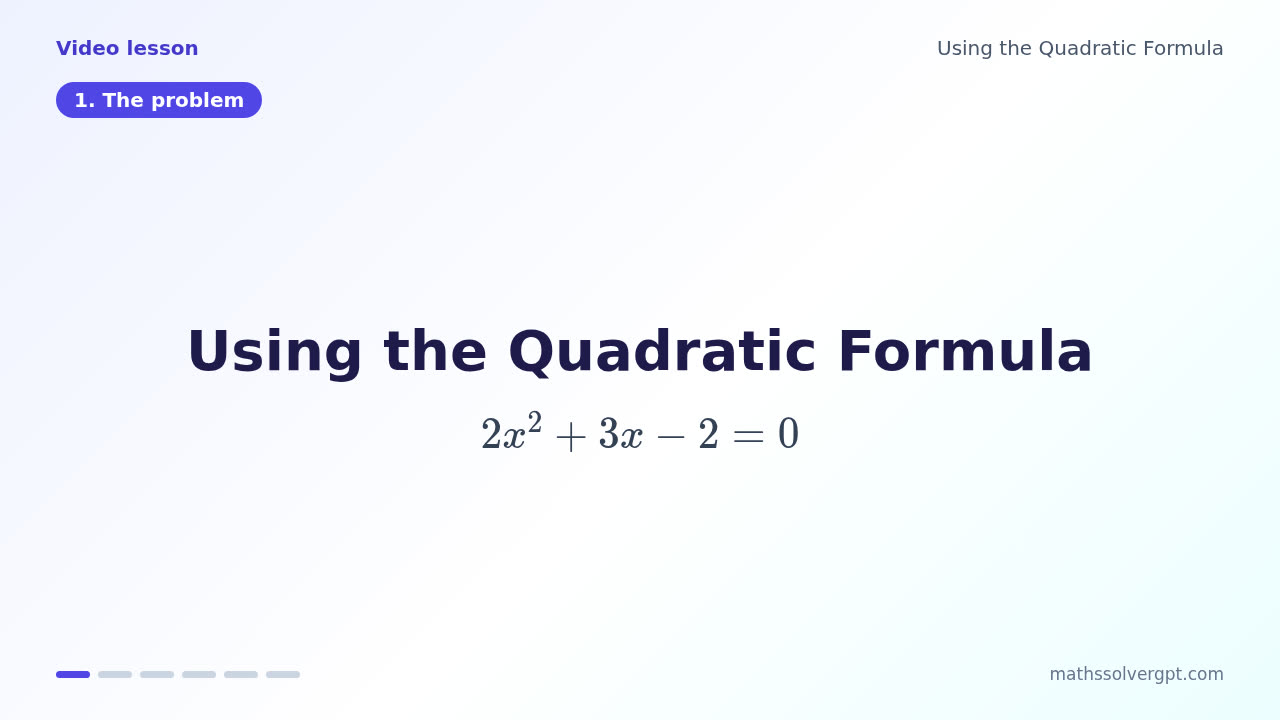 1:20
Solve 2x² + 3x − 2 = 0 with the quadratic formula: identify a, b and c, use the discriminant, simplify both roots and confirm them on the graph.
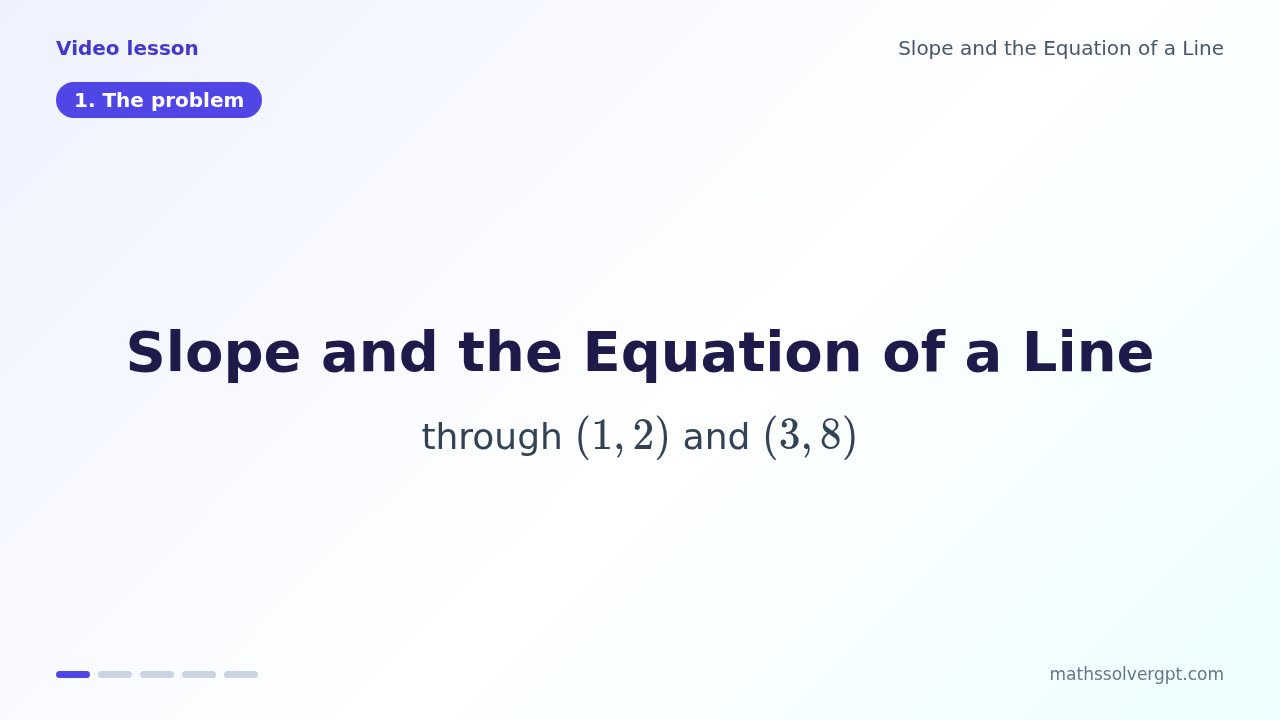 0:57
Find the slope through (1, 2) and (3, 8), build the line y = 3x − 1 in slope-intercept form, and check both points on the graph.